How to Optimize SQL Queries for Faster Sites
This article was originally published on the Delicious Brains blog, and is republished here with permission.
You know that a fast site == happier users, improved ranking from Google, and increased conversions. Maybe you even think your WordPress site is as fast as it can be: you've looked at site performance, from the best practices of setting up a server, to troubleshooting slow code, and offloading your images to a CDN, but is that everything?
With dynamic, database-driven websites like WordPress, you might still have one problem on your hands: database queries slowing down your site.
In this post, I’ll take you through how to identify the queries causing bottlenecks, how to understand the problems with them, along with quick fixes and other approaches to speed things up. I’ll be using an actual query we recently tackled that was slowing things down on the customer portal of deliciousbrains.com.
Identification
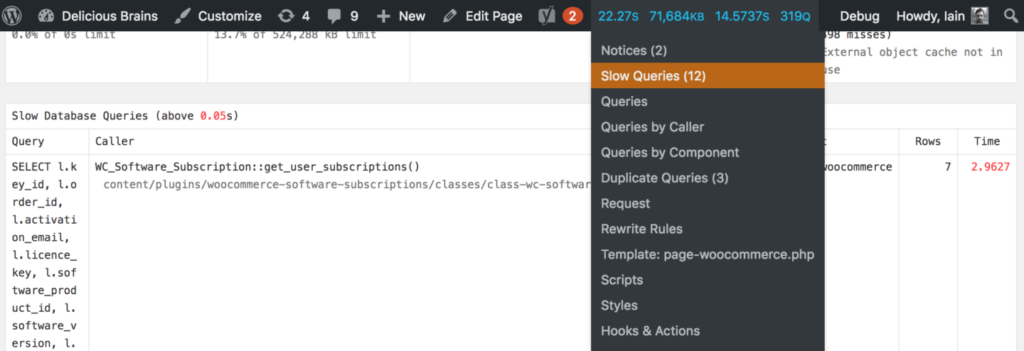
The first step in fixing slow SQL queries is to find them. Ashley has sung the praises of the debugging plugin Query Monitor on the blog before, and it’s the database queries feature of the plugin that really makes it an invaluable tool for identifying slow SQL queries. The plugin reports on all the database queries executed during the page request. It allows you to filter them by the code or component (the plugin, theme or WordPress core) calling them, and highlights duplicate and slow queries:

If you don’t want to install a debugging plugin on a production site (maybe you’re worried about adding some performance overhead) you can opt to turn on the MySQL Slow Query Log, which logs all queries that take a certain amount of time to execute. This is relatively simple to configure and set up where to log the queries to. As this is a server-level tweak, the performance hit will be less that a debugging plugin on the site, but should be turned off when not using it.
Understanding
Once you have found an expensive query that you want to improve, the next step is to try to understand what is making the query slow. Recently during development to our site, we found a query that was taking around 8 seconds to execute!
SELECT
    l.key_id,
    l.order_id,
    l.activation_email,
    l.licence_key,
    l.software_product_id,
    l.software_version,
    l.activations_limit,
    l.created,
    l.renewal_type,
    l.renewal_id,
    l.exempt_domain,
    s.next_payment_date,
    s.status,
    pm2.post_id AS 'product_id',
    pm.meta_value AS 'user_id'
FROM
    oiz6q8a_woocommerce_software_licences l
        INNER JOIN
    oiz6q8a_woocommerce_software_subscriptions s ON s.key_id = l.key_id
        INNER JOIN
    oiz6q8a_posts p ON p.ID = l.order_id
        INNER JOIN
    oiz6q8a_postmeta pm ON pm.post_id = p.ID
        AND pm.meta_key = '_customer_user'
        INNER JOIN
    oiz6q8a_postmeta pm2 ON pm2.meta_key = '_software_product_id'
        AND pm2.meta_value = l.software_product_id
WHERE
    p.post_type = 'shop_order'
        AND pm.meta_value = 279
ORDER BY s.next_payment_date
We use WooCommerce and a customized version of the WooCommerce Software Subscriptions plugin to run our plugins store. The purpose of this query is to get all subscriptions for a customer where we know their customer number. WooCommerce has a somewhat complex data model, in that even though an order is stored as a custom post type, the id of the customer (for stores where each customer gets a WordPress user created for them) is not stored as the post_author, but instead as a piece of post meta data. There are also a couple of joins to custom tables created by the software subscriptions plugin. Let’s dive in to understand the query more.
MySQL is your Friend
MySQL has a handy statement DESCRIBE which can be used to output information about a table’s structure such as its columns, data types, defaults. So if you execute DESCRIBE wp_postmeta; you will see the following results:
| Field | Type | Null | Key | Default | Extra |
|---|---|---|---|---|---|
| meta_id | bigint(20) unsigned | NO | PRI | NULL | auto_increment |
| post_id | bigint(20) unsigned | NO | MUL | 0 | |
| meta_key | varchar(255) | YES | MUL | NULL | |
| meta_value | longtext | YES | NULL |
That’s cool, but you may already know about it. But did you know that the DESCRIBE statement prefix can actually be used on SELECT, INSERT, UPDATE, REPLACE and DELETE statements? This is more commonly known by its synonym EXPLAIN and will give us detailed information about how the statement will be executed.
Here are the results for our slow query:
| id | select_type | table | type | possible_keys | key | key_len | ref | rows | Extra |
|---|---|---|---|---|---|---|---|---|---|
| 1 | SIMPLE | pm2 | ref | meta_key | meta_key | 576 | const | 28 | Using where; Using temporary; Using filesort |
| 1 | SIMPLE | pm | ref | post_id,meta_key | meta_key | 576 | const | 37456 | Using where |
| 1 | SIMPLE | p | eq_ref | PRIMARY,type_status_date | PRIMARY | 8 | deliciousbrainsdev.pm.post_id | 1 | Using where |
| 1 | SIMPLE | l | ref | PRIMARY,order_id | order_id | 8 | deliciousbrainsdev.pm.post_id | 1 | Using index condition; Using where |
| 1 | SIMPLE | s | eq_ref | PRIMARY | PRIMARY | 8 | deliciousbrainsdev.l.key_id | 1 | NULL |
At first glance, this isn’t very easy to interpret. Luckily the folks over at SitePoint have put together a comprehensive guide to understanding the statement.
The most important column is type, which describes how the tables are joined. If you see ALL then that means MySQL is reading the whole table from disk, increasing I/O rates and putting load on the CPU. This is know as a “full table scan” (more on that later).
The rows column is also a good indication of what MySQL is having to do, as this shows how many rows it has looked in to find a result.
Explain also gives us more information we can use to optimize. For example, the pm2 table (wp_postmeta), it is telling us we are Using filesort, because we are asking the results to be sorted using an ORDER BY clause on the statement. If we were also grouping the query we would be adding overhead to the execution.
Visual Investigation
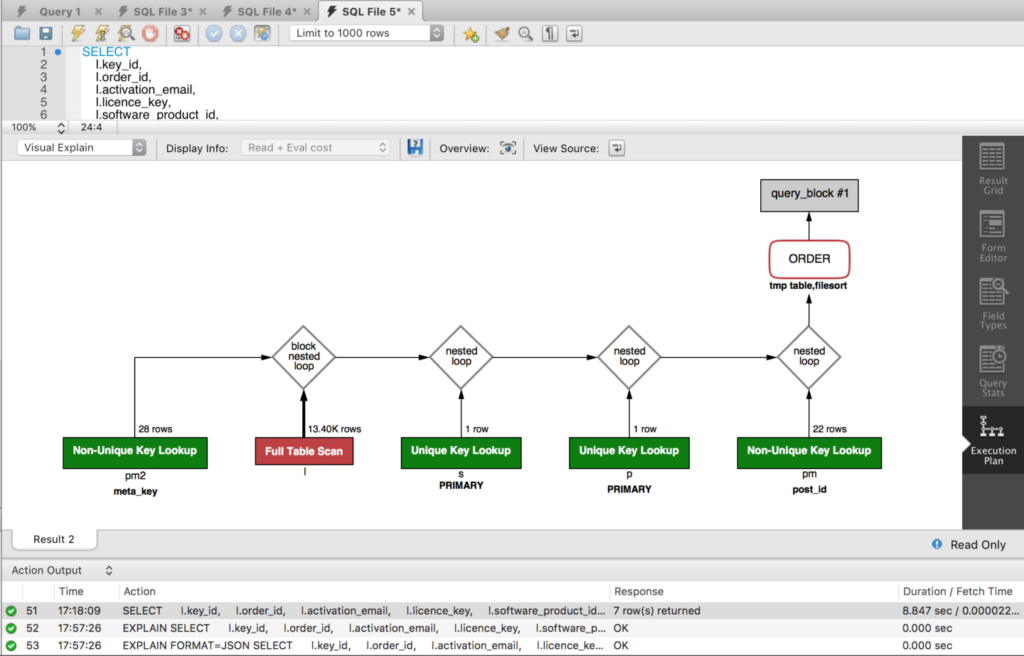
MySQL Workbench is another handy, free tool for this type of investigation. For databases running on MySQL 5.6 and above, the results of EXPLAIN can be outputted as JSON, and MySQL Workbench turns that JSON into a visual execution plan of the statement:

It automatically draws your attention to issues by coloring parts of the query by cost. We can see straight away that join to the wp_woocommerce_software_licences (alias l) table has a serious issue.
Continue reading %How to Optimize SQL Queries for Faster Sites%